

As an SEO expert who has helped optimize Core Web Vitals since its introduction, the upcoming switch from First Input Delay to Interaction to Next Paint is a major development.
My name is Terry Williams, and I'm an experienced technical SEO consultant and co-founder of SerpFocus. Over the past two years, I've assisted dozens of clients in improving their user experience metrics in preparation for Google's rollout of Core Web Vitals as a ranking factor.
Now, Google has announced they will replace First Input Delay (FID) with a new metric called Interaction to Next Paint (INP) in March 2024. This represents one of the biggest changes to Core Web Vitals since its launch.
In this post, I'll explain what Interaction to Next Paint measures, how it differs from First Input Delay, and most importantly - what you can do to optimize it for a better overall user experience.
As leaders in the SEO space, we've been eagerly anticipating this switch to INP and are ready to leverage our expertise to help clients understand and thrive under the new metric. Let's dive in!
What Does Interaction to Next Paint Measure?
Interaction to Next Paint (INP) is a new responsiveness metric from Google that will replace First Input Delay. It measures the time from a user interacting with your site (like clicking a button) to when the browser next renders changes visually in response to that interaction.
Specifically, INP calculates the time between the first input event like a mouse click to the browser's next paint - which is when the browser renders updated pixels to the screen. This helps benchmark how quickly your site provides visual feedback after a user initiates an action.
The key is that INP does not measure the total time to fully complete an interaction. It is focused on measuring just the initial visual response time, like a dropdown opening or loading indicator displaying. Showing the interaction has successfully started provides a smoother UX.
Optimizing INP is especially important for highly interactive sites like web apps, ecommerce platforms, and social media that involve many user inputs. Sluggish response times after clicking or tapping creates frustrating lag that increases abandonment.
Even complex workflows that require longer processing can feel responsive by rendering incremental visual progress indicators. INP rewards thoughtfully designed experiences that feel lively and reactive to users.
By pushing sites to provide rapid visual feedback, INP aims to reduce perceived latency and friction during interactions. Let's explore why Google selected INP to replace FID and how sites can prepare for the change.
Or, if you’re looking for Google’s definition:
“INP assesses responsiveness using data from the Event Timing API. When an interaction causes a page to become unresponsive, that is a poor user experience. INP observes the latency of all interactions a user has made with the page, and reports a single value which all (or nearly all) interactions were below. A low INP means the page was consistently able to respond quickly to all—or the vast majority—of user interactions.”
Defining Interactions in INP
To properly understand and measure INP, it's important to clarify Google's definition of an "interaction".
An interaction consists of a logical group of browser events tied to the same user action. For example, clicking a button on a webpage involves pointerdown, pointerup, and other affiliated events.
Google determines the duration of an interaction as the longest event in the sequence. So if pointerdown took 50ms but pointerup took 100ms, the interaction duration would be 100ms.
INP specifically measures these types of user-initiated interactions:
- Mouse clicks
- Touchscreen taps
- Keyboard button presses
As an example, here is how Google defines the full interaction timeline when a user clicks a button:
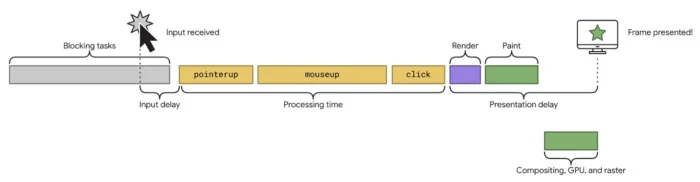
There are three key durations that comprise the total interaction time Google uses for INP:
- Input Delay: Time from click to initial response like button highlight color change
- Processing Time: Duration of code executing in response to interaction
- Presentation Delay: Time to determine layout changes and render on screen
By adding input delay, processing time, and presentation delay, Google calculates the total interaction duration which INP measures to gauge responsiveness.
Understanding Google's full criteria for defining interactions is essential context for accurately tracking and improving your INP metric. Tiny delays in the interaction timeline accumulate into a slow overall experience.
Comparing First Input Delay vs. Interaction to Next Paint
To fully grasp the implications of the switch, it's helpful to understand how INP differs from the existing FID metric it will replace.
First Input Delay (FID)
FID measures the time from the first user input on a page (like clicking a link) to the time when the browser is actually able to respond to that event.
It focuses solely on the very first interaction on a page. FID does not measure visual feedback - only when the interaction is registered by the browser.
Interaction to Next Paint (INP)
INP calculates the time from user input to when the browser renders graphical changes in response. This provides a visual feedback measurement.
INP also evaluates every single interaction on a page, not just the initial input. This enables assessing the ongoing responsiveness of things like buttons, menus, and forms.
What Constitutes a Good INP Score?
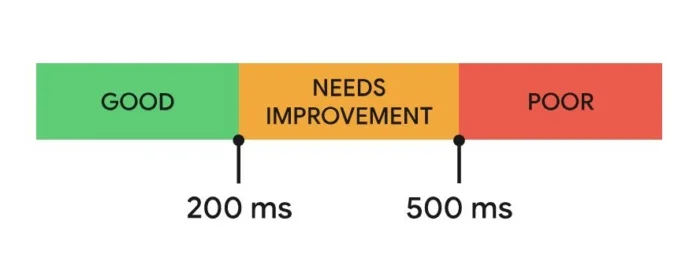
Google has provided guidelines on optimal INP values based on the 75th percentile of field data:
- ≤ 200 milliseconds - Site has good responsiveness
- 200-500 milliseconds - Responsiveness needs improvement
- 500+ milliseconds - Poor responsiveness
The threshold targets encourage fast visual feedback after interactions, reducing perceived lag for users. Let's explore tips for optimizing INP based on these recommendations.
Why Is Google Replacing FID With INP?
In March 2024, Interaction to Next Paint will replace First Input Delay as one of Google's Core Web Vitals metrics, alongside Largest Contentful Paint and Cumulative Layout Shift.
Google's reasoning for the change comes down to INP providing a more representative measure of overall user experience during a browser session.
According to Chrome data, around 90% of time spent on a webpage occurs after it finishes loading. This means the first interaction is only a small fraction of a user's engagement.
Because FID only measures the very first input delay, it fails to capture potential lag and frustration during all subsequent interactions with page elements.
INP provides a more complete picture by evaluating response times every time a user clicks, taps, or presses keys to interact with a site. Identifying delays here is more aligned with real UX pitfalls.
Given that the majority of time on a page is spent on post-load interactions, INP will give webmasters actionable insights into consistently speeding up site interactions, not just optimizing the initial load experience.
Switching to INP realigns Core Web Vitals metrics to focus on parts of user experience with the greatest room for improvement as determined by meaningful field data.
How to Measure and Optimize Interaction to Next Paint
With INP becoming a key user experience metric, here are tips for monitoring and improving your scores:
1. Measure INP in the field
Ideal INP metrics come from real user interactions on your live site. The Chrome UX Report provides field data if eligible. Otherwise, use Real User Monitoring tools like Pingdom or Raygun to collect live scores.
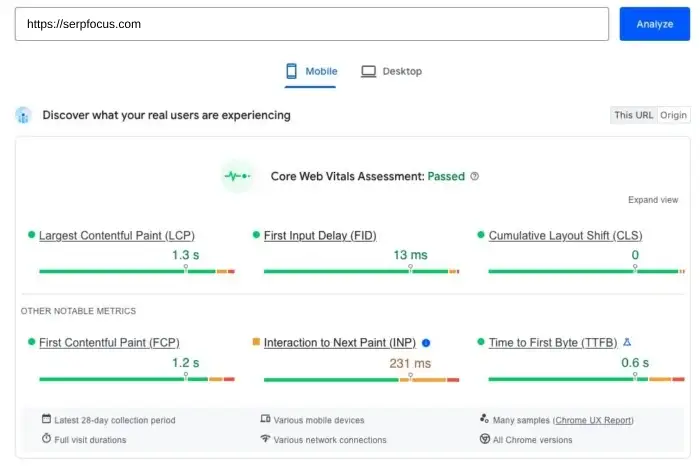
2. Leverage Google PageSpeed Insights
PageSpeed Insights uses a mix of real-world data and lab data to generate free INP scores for any URL. This helps benchmark site responsiveness when field data is unavailable.
3. Optimizing the Three Phases of an Interaction
As covered earlier, INP breaks down interactions into input delay, processing time, and presentation delay. Optimizing each stage improves overall responsiveness.
Optimizing Input Delay
To minimize input delay:
- Optimize JavaScript execution by minimizing files, enabling compression, using CDNs, and frameworks like jQuery.
- Reduce thread activity by offloading non-critical operations to web workers.
- Avoid overlapping interactions by debouncing inputs and aborting outgoing requests.
Optimizing Processing Time
To reduce processing time:
- Minimize unnecessary event callback code triggered by interactions.
- Break up essential callbacks into discrete tasks so UI updates run first.
- Use setTimeout to run lower priority callbacks in separate tasks.
Optimizing Presentation Delay
To accelerate presentation:
- Reduce DOM size by removing bloat, avoiding complex page builders and CSS.
- Add immediate loading and validation cues like progress bars to provide feedback.
- Target under 1400 DOM nodes for optimal rendering speed.
A slow phase anywhere along the interaction timeline accumulates into a poor overall INP score. But by optimizing each stage, you can achieve snappy, responsive interfaces. Measure regularly to validate improvements.
FAQ
What is the impact of adopting INP instead of FID?
The expanded scope of INP provides a better reflection of overall site interactivity. But it may require more optimization to perform well on all user interactions versus just first input.
How can I improve my INP score?
Key ways to improve INP include minimizing JavaScript, simplifying code, adding loading indicators, reducing DOM size, debouncing inputs, and optimizing hosting and caches.
Is INP a ranking factor?
Not yet directly. But optimizing INP improves user experience, which can indirectly improve rankings. Google may eventually incorporate it as a ranking factor.
How is INP calculated exactly?
INP measures time from user input to visual changes rendered by the browser. It sums input delay, processing time, and presentation delay.
What tools can I use to measure INP?
Top options are Chrome User Experience Report, PageSpeed Insights, and Real User Monitoring tools like Pingdom and Raygun.
What is a good INP score to target?
Google recommends 200ms or under as good. Between 200-500ms needs improvement. Over 500ms is poor.
When does Google switch to INP?
The switch from FID to INP as a Core Web Vital happens in March 2024.